

This post has been in the works for some time. Unlike other posts focusing on a specific topic or one particular company, this is a little bit of a milestone in my investing journey. It marks the end of what I would consider the first phase of my foray into value investing. In this article, I lay bare my stock-picking results over the past three years, quarter-by-quarter. Using specific examples, I then reflect on some lessons picked up over the past three years (30 June 2018 to 30 June 2021).
As a disclaimer, I must mention the fact that the majority of my investments are in index funds, which you can read about here. Less than half of my invested assets are in individual stocks.
I bought my first stock on 4 July 2018, and my second on 7 August 2018. The first was Mapletree Logistics Trust (SGX: M44U), while the second was Singpost (SGX: S08). By some strange coincidence, I transacted in both at the same price of $1.23 per unit on the respective purchase dates.
In the third quarter of 2019 (after about a year of holding), I sold my Mapletree Logistics Trust shares at an average price of $1.617 each, a decent 31% profit (not even including dividends, which were quire generous). Singpost, on the other hand, went south quite quickly. I finally cut my losses in the second quarter of 2020, selling all my Singpost shares for $0.755 apiece (at a steep 39% loss). With hindsight, many mistakes were made here (even with Mapletree Logistics).
As you are told all too often, we learn from our mistakes. Especially so when our mistakes cost money. In fact, I might argue that it is impossible to learn discipline in value investing without first losing some money.
Results
First, let us go into the results of my portfolio over the past three years (30 June 2018 to 30 June 2021). It is not straightforward to determine the return because I have been steadily adding funds to my discretionary portfolio during the past three years (therefore the value of my portfolio currently is many times larger than what I started with three years ago).
What I have done instead is to only add funds just after each financial quarter (the financial quarters comprise three months each, starting with Jan-Mar and so on). With this, I can calculate the return each quarter (“final value” minus “initial value” divided by “initial value”) and then compound the quarterly returns to get the overall return.
This is not the only difficulty in analysing performance. The main benchmark in the Singapore stock market, the Straits Times Index (STI), has no ‘total return’ counterpart (a total return index is one that includes the effects of dividends). That is, simply comparing the performance of my portfolio to the STI would be unfair because the stocks in my portfolio paid dividends which I included in the portfolio returns, but the STI constituents also pay dividends which are ignored by the index. To get around this, I have two separate comparisons – the STI and the STI adjusted for dividends (approx). To derive the latter, I added 1% return per quarter to the performance of the STI, which gives just over 4% additional return. Since the STI has been yielding less than 4% in dividends recently, this will give an overestimate of the STI’s performance.
| Three-year return | Annualised return | |
| My discretionary portfolio | 30.56% | 9.30% |
| STI with dividends (approx) | 8.03% | 2.61% |
| STI | -4.23% | -1.43% |
As of 30 June 2018 (just before the first quarter of the three-year period), the STI was 3,268.70. As of 30 June 2021 (just after the final quarter of the three-year period), the STI was 3,130.46. That is, the STI was actually fell by 4.23% over this three-year period, or an annualised loss of 1.43% per annum. With the overestimated dividends (1% per quarter, for ease of calculation) reinvested, the STI with dividends gave a total return of 8.03%, or an annualised return on investment of 2.61% per annum.
My discretionary portfolio, in contrast, rose by 30.56% during this three-year period, or an annualised return on investment of 9.30% per annum. Finance professionals call the difference between the performance of a discretionary portfolio and a benchmark index ‘alpha’. In this case, my portfolio has an alpha of 10.73% compared to the STI, and 6.69% relative to the STI with 1% per quarter assumed dividends.
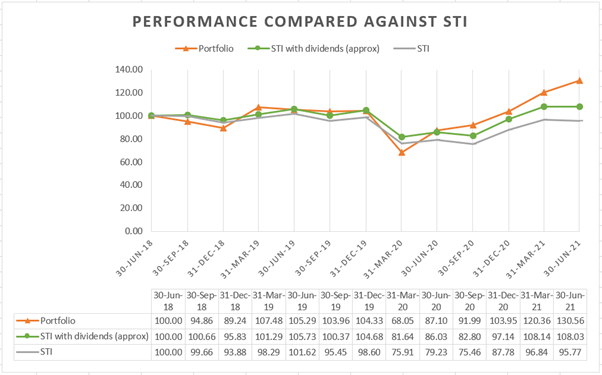
Above is a chart showing the quarter-by-quarter performance, with the numbers included at the bottom. One way of thinking about the numbers is the value of $100 invested on 30 June 2018. This means that $100 invested in my portfolio on 30 June 2018 would be worth $130.56 on 30 June 2021, whereas $100 invested in the STI (with dividends reinvested) would be worth about $108.03 on 30 June 2021.
Two interesting points worth noting are:
- My discretionary portfolio is more volatile than the STI.
When the world was locked down in the first quarter of 2020 due to Covid-19, my discretionary portfolio took a bigger hit than the STI. The performance of my portfolio in that quarter was -34.78%, compared to the STI’s -23.01% (and -22.01% if you include the 1% per quarter dividend).
Based on the main school of thought which more or less equates volatility with risk, my portfolio has higher risk than the index due to greater volatility.
- The outperformance came only in the past 1 year.
As you can see from the chart, my discretionary portfolio was doing significantly worse than the STI up until 31 March 2020. From 31 March 2020 to 30 June 2021, however, my portfolio leapt up by 91.9% in just five quarters. This was mainly due to some selective buys during the depths of the pandemic market depression, but what really enabled this was my accumulation of knowledge and experience from my previous mistakes.
A further reason for the outperformance in the past year is that type of companies that I look to invest in (steady earnings and little debt) are precisely those that were oversold in 1Q2020 and subsequently sprung back quickly.
Best investment decision: Koda
Koda (SGX: BJZ), a relatively small company (market cap under S$100m), has been one of my best investment decisions. Koda designs and manufactures wooden furniture, selling to furniture retailers around the world as well as in its own retail stores. Koda had recently pulled-off a successful business turnaround plan and has very low debt.
On 21 May 2020, I bought Koda shares at $0.355 apiece. Following the broader market recovery, Koda shares rose in the following month. But my conviction in the company remained strong and instead of selling, I bought an equal amount of Koda shares at $0.44 apiece on 21 September 2020. This brings my average purchase price to about $0.40.
How did I come about this decision? I used the basic value investing principles and ensured that a margin of safety existed before buying Koda shares. Back then, I had estimated that the intrinsic value of Koda was at least $0.60 per share, so buying Koda shares at even $0.44 was a good deal.
As of 30 June 2021, Koda closed at $0.79, marking an unrealised gain of almost 100% in about a year (‘unrealised’ because I have not cashed out). Yet, I have no immediate plans to sell. I believe that Koda shares are worth at least $1.00 currently, and also believe that the company will continue to grow in the years to come.
Worst investment decision: Singpost
Without a doubt, my worst investment decision was to buy Singpost (SGX: S08), Singapore’s main postal services provider. I was enamoured by the strong heritage of the company and confident in my naïve and simplistic intuition that any company involved in the delivery of parcels must thrive in our age of e-commerce.
I bought Singpost shares at $1.23 apiece on 7 August 2018 and the slide began soon after. In the depths of the pandemic-induced market crash, I cut my losses and sold my Singpost shares at $0.755 on 21 May 2020. This turned out to be a good decision, as Singpost shares closed even lower at $0.715 on 30 June 2021, despite a wider recovery in the Singapore stock market.
What went wrong? Very simply, I had no idea what true value investing was. I was caught up reading articles about Singpost and was infatuated with the company without really digging into the financial statements. Worse still, I did not conduct any calculation of intrinsic value. I relied purely on an imaginative narrative of the company that had formed in my head, along with a stubborn contrarian streak. I detail this lesson in the following section.
One key lesson
Value investing is not contrarian investing. A value investor must pay attention to both the intrinsic value as well as the market price. A good value investment opportunity occurs when the market price of a security is significantly below its intrinsic value, which amounts to buying a nice jacket at a steep discount.
Contrarian investing means going against the crowd for the sake of doing so. This means buying or selling in the direction opposite to what most of the rest of the market is doing, believing that the majority is wrong.
It was with a contrarian streak that I bought shares in companies like Singpost and Sing Investment and Finance (SGX: S35). In these cases, I did not attempt to calculate intrinsic value per share, but rather, argued that the share price is likely to be undervalued simply because I predicted that these stocks were out-of-favour at that point. As it turns out, these positions were closed at a loss.
I now make a deliberate effort to avoid contrarian thinking and focus on calculating intrinsic value.
My current holdings
As of 30 June 2021, I hold shares in (in alphabetical order):
- AEM Holdings (SGX: AWX);
- APAC Realty (SGX: CLN);
- Centurion Corporation (SGX: OU8);
- China Sunsine (SGX: QES);
- Koda (SGX: BJZ);
- Tat Seng Packaging (SGX: T12);
- Yangzijiang Shipbuilding (BS6).
I am currently on the lookout for an opportunity to sell my shares in APAC Realty because I am not so confident in the sustainability of the very strong demand for local housing that we have seen in the past one year.
Quarterly activity report
For those interested (and for full transparency), I have decided to include a table of all my trading activity, organised by quarters.
| Quarter | Trades |
| 3Q2018 | Bought Mapletree Logistics Trust (M44U) at $1.23Bought Singpost (S08) at $1.23Bought APAC Realty (CLN) at $0.605Bought Sing Investment and Finance (S35) at $1.50 |
| 4Q2018 | NIL |
| 1Q2019 | Bought APAC Realty (CLN) at $0.45 |
| 2Q2019 | NIL |
| 3Q2019 | Sold Mapletree Logistics Trust (M44U) at average price of $1.617Bought Tat Seng Packaging (T12) at average price of $0.504Bought Cromwell European REIT (CSFU) at $0.75 |
| 4Q2019 | NIL |
| 1Q2020 | Bought China Sunsine (QES) at average price of $0.494Bought Yangzijiang Shipbuilding (BS6) at average price of $0.913 |
| 2Q2020 | Bought China Sunsine (QES) at $0.34Sold Singpost (S08) at $0.755Bought Koda (BJZ) at $0.355 |
| 3Q2020 | Bought Centurion (OU8) at $0.36Sold Sing Investment and Finance (S35) at average price of $1.17Bought Koda (BJZ) at $0.44Bought Capitaland (C31) at $2.61 |
| 4Q2020 | Bought Capitaland (C31) at $2.61Bought Yangzijiang Shipbuilding (BS6) at $0.945 |
| 1Q2021 | Bought Capitaland (C31) at $3.14Bought Centurion (OU8) at $0.335Sold Cromwell European REIT (CSFU) at $0.71 |
| 2Q2021 | Bought AEM (AWX) at average price of $3.67Sold Capitaland (C31) at $3.69Bought Centurion (OU8) at $0.335 |
As you can see, my trading activity has gone up quite a bit in the past one year. I am hoping to reduce this in the next few quarters to a maximum of 2 trades per quarter. Research has shown time and time again that frequent trading tends to correlate with poorer results.
Final thoughts and future plans
I am reasonably satisfied with the performance of my discretionary portfolio over the past three years. It has managed to outperform the STI significantly. Of course, any discretionary portfolio unable to outperform the benchmark index consistently is pretty much useless.
But what is important are the lessons that I have learnt and internalised over the past three years.
I will continue picking stocks, adjusting my approach as and when I deem efficacious. With this milestone analysis completed and demonstrating outperformance of the index, I do intend to allocate a larger portion of my savings to my discretionary portfolio (and less to index funds). I will continue compiling the quarterly results for the foreseeable future, and might write articles periodically analysing the ongoing performance.
Back to the first section. I wrote that my trades in Mapletree Logistics Trust and Singpost were both mistakes. The latter is clear, as explained in this article. But why is the 31% capital gain on Mapletree Logistics Trust a mistake? Because I was greedy to realise the profit and sold too early (at an average price of $1.617 in 3Q2019). As of 30 June 2021, Mapletree Logistics Trust closed at $2.05 per unit. Even profitable positions can be mistakes!
